+48 453 250 842
 office@bitpeak.com


The client
A globally diversified healthcare company with a central purpose to help people live their healthiest possible lives. The organization offers a broad portfolio of market-leading products that align with favorable long-term healthcare trends in both developed and developing markets. With more than 100 000+ employees and 4000+ FLMs in 160+ countries discovering new ways to make life better.
The challenge
Our client was conducting operations in emerging markets such as METAP, APAC, CIS and Russia regions. Among each of the 50+ countries in those areas there were different KPIs, reporting standards and business logic characteristics.
This meant that it was difficult to track and compare the performance of sales and marketing representatives in different regions. This in turn, inhibited management from fully utilizing and developing their employees. Additionally, it was difficult to obtain a holistic overview of sales trends and processes in those markets.
To facilitate high-level decision making as well as optimal management of sales teams, a single source of truth with unified KPIs was required. BitPeak’s task was to provide unified, scalable, in-cloud, an easy–to–use solution with flexible business logic allowing business users to obtain measurable value from it.
The scope
- We had to integrate data from multiple separate the source and four Salesforce instances, while ensuring quality and harmonization of the information.
- We had to unify KPI’s and definition from multiple regions, while also providing way to incorporate differences and unique characteristics of each country.
- We had to design the solution that was both easy to use and could provide in-depth information, to provide actual value to business users.
The solution
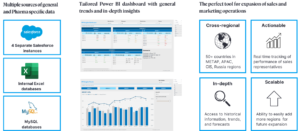
The core of our solution is an advanced Power BI Dashboard with multiple functionalities, with the main task of tracking and analyzing sales and marketing team performance.
The data is sourced from 4 separate Salesforce instances, internal excel databases and MySQL databases. After sourcing we clean, harmonize and structure data to ensure its internal and external compatibility.
After integrating data into the dashboard, business users could access it depending on their clearance level. We ensured that the usage of dashboard was easy, and that additional toolboxes and UI were clear enough to not require much further training to access its full capabilities.
The dashboard presented multiple KPI and allowed for analysis of data and trends inside one region, as well as comparisons between regions or countries. Additionally, by using flexible business logic we preserved the ability to see unique characteristics of each country and region.
To increase business value of the dashboard we provided users with an ability to analyze historical data, gain holistic overview of marketing and sales trends, as well as gain access to 40+ specialized KPIs focused on the performance of Sales Representatives such as:
- Calls rate
- Time in field
- Coverage & frequency
- Turn-over-rate
- HC Plan
- Vacant HC
- Calls per day
- CLM usage
…And more! The goal was to not only enable managers to fully utilize their employees and help their development, but also allow for better and quicker strategic decisions.
To reach our goal we used the following tech stack:
- AWS: for Cloud data storage solution
- Power BI: for dashboard design and customization
- Salesforce: as a source of sales and marketing data
- IDERA: for definition of business calculations in data model
- ETL (SQL): for data exports, transfers and loading
Benefits:
Management
Managers were able to easily and quicky access verifiable information about performance KPIs of their employees and compare them to the performance in other regions. This allowed them to better manage their employees, choose their targets and fully utilize their potential.
Strategy
The strategic decision makers were able to access holistic overview of marketing and sales team’s performance and analyze it against both historical trends and future forecasts. The ability to freely choose levels of comparison between a particular country, region or global area. This allowed for quicker strategic decisions based on in-depth data.
Operations
The dashboard we provided to the client ensured easy, single-source access to constantly updated information with an easy-to-use interface and custom filters. Additionally, we migrated the solution to cloud ensuring stable and secure environment. This resulted in widespread use of the dashboard among business users.