 +48 453 250 842
 office@bitpeak.com
 Opatowska 2, Warsaw

The client
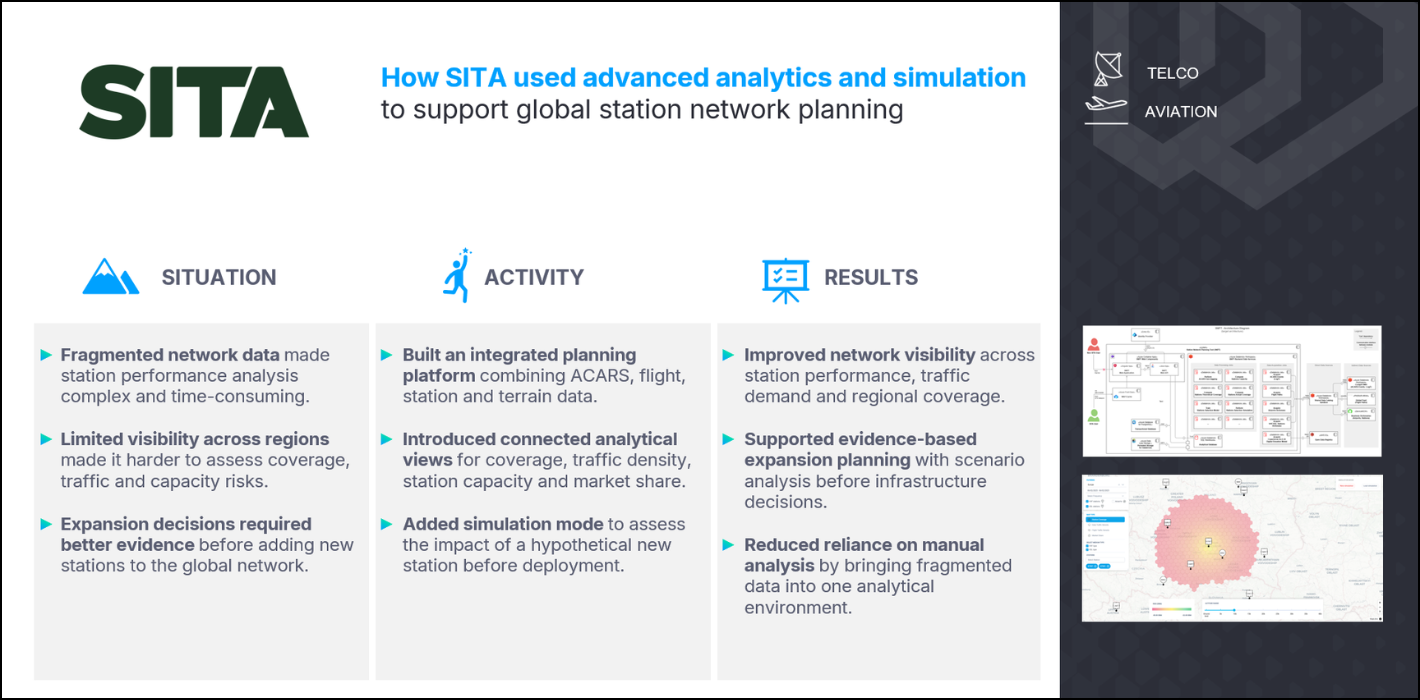
SITA is a global leader in air transport communications and IT solutions. Drives digital transformation for more than 400 customers, covering 18,000 commercial aircraft and partnering with over 90 air navigation service providers. Serving 90% of the world’s airlines, SITA offers solutions like digital operations management, aircraft data handling, and seamless communication services for aircraft.
The challenge
For organizations managing global communication infrastructure, network planning decisions require a clear understanding of how assets perform across regions, traffic conditions and market environments. Expanding or optimizing such a network is not only a technical question. It also requires reliable insight into demand, coverage, capacity, competitive position and the expected impact of potential infrastructure investments.
SITA has a worldwide network of antennas. However, it lacked a centralized analytical tool that integrated data from all its sources and provided detailed statistics. The challenge they faced was no easy access to information such as:
- How does a particular station perform compared to neighboring stations?
- Are our stations overloaded or underloaded in a specific region?
- Are there regions of the world where our performance is exceptionally good or exceptionally bad?
- What would happen if we placed a station in a specific area (e.g., underperforming region)?
- What percentage of markets do we own in different regions of the world (where our competitors are stronger and where we have advantage)?
Multiple and incompatible data sources made ad-hoc analysis hard, unreliable, and costly due to the complexity of ACARs messages mechanics, and SITA needed it in one place, integrated.
The solution
We developed an internal analytical and planning platform that helps SITA assess the performance of its global station network and make more informed expansion decisions. The application integrates ACARS messages, PASSUR flight data, station parameters and terrain geodata into one environment for analyzing coverage, traffic, capacity and market position.
Application structure
By replacing fragmented reports and manual ad hoc analysis with a centralized web application, the solution provides planning teams with a consistent view of the network. Each module supports a different business question, from understanding how individual stations perform to identifying where additional infrastructure could create the highest operational or commercial value.
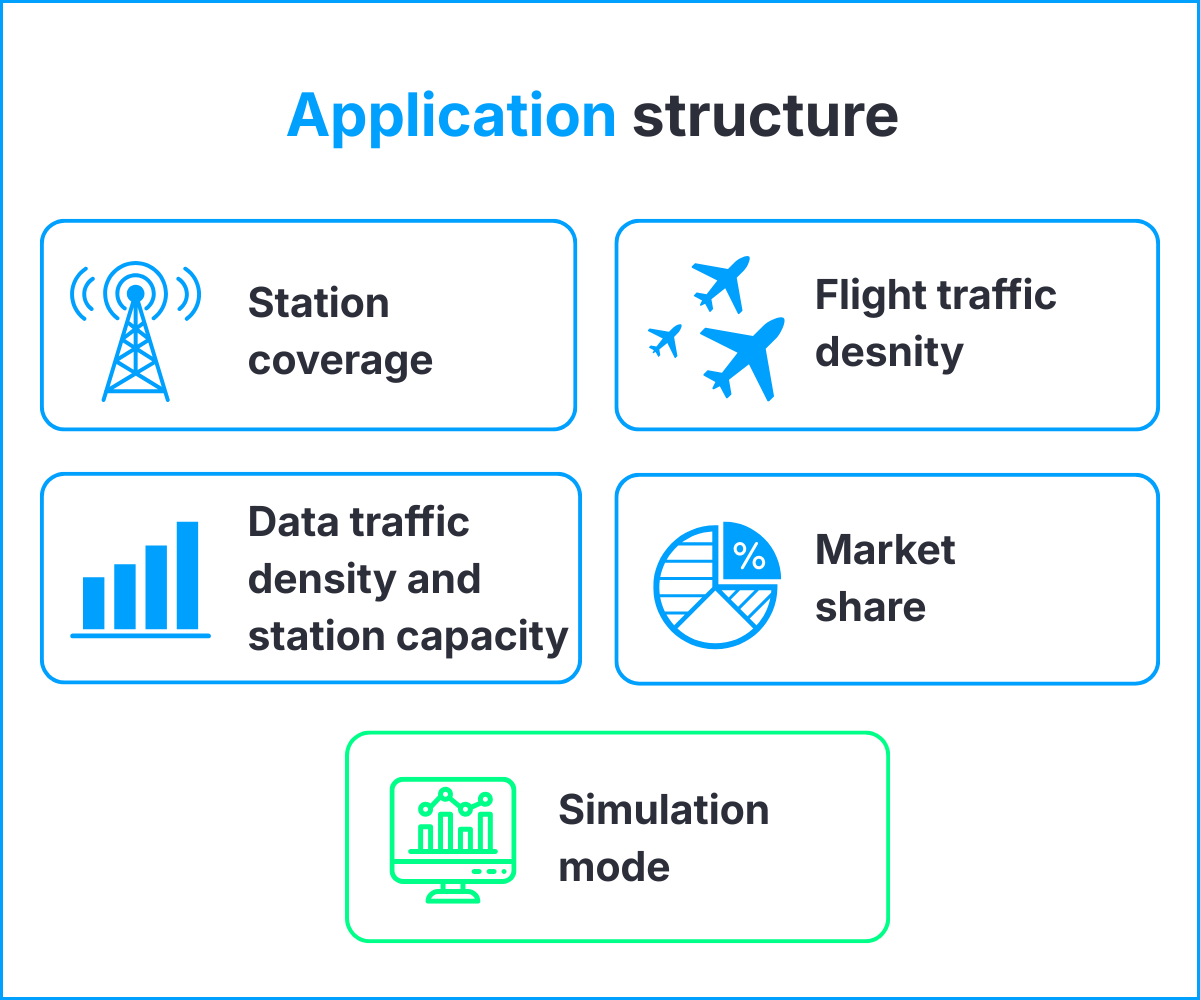
Station Coverage – shows the realistic reach of each station across regions and altitude levels, including terrain limitations that may affect signal availability.
Flight Traffic Density – presents where aircraft traffic is concentrated, helping teams understand which regions, corridors and altitude ranges generate the highest operational demand.
Data Traffic Density and Station Capacity – combines communication traffic analysis with station load monitoring to identify high-message areas and stations at risk of congestion.
Market Share – estimates SITA’s traffic share across regions, helping teams see where the network position is strong, where competitors may be stronger and where expansion opportunities could exist.
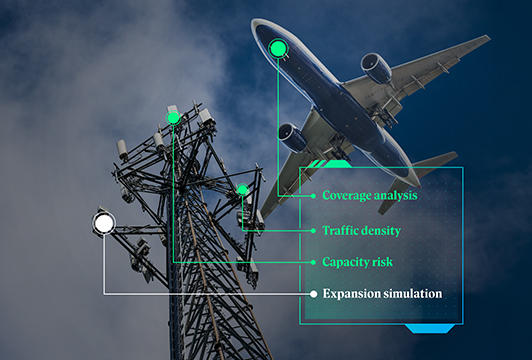
Simulation Mode – allows teams to test a hypothetical new station before deployment and assess its potential impact on coverage, traffic capture, congestion risk and market share.
Simulation Mode as a planning capability
Beyond network monitoring, the simulation module turns the application into a scenario-planning tool. Planning teams can model a potential station location in advance and understand its expected impact before committing to infrastructure decisions.
The analysis focuses on the traffic and geography that could realistically be affected by the proposed station. As a result, teams can assess whether a location could improve practical coverage, capture additional traffic, affect station-capacity risk or strengthen SITA’s position in a strategically important area.
The module supports business users in evaluating:
- how a new station could change practical coverage;
- which traffic could realistically be affected by the proposed location;
- how much traffic could potentially be captured by the new station;
- how the proposed station could affect station-capacity risk;
- how estimated SITA share could change in the analyzed area.
By making potential outcomes visible before deployment, the module reduces planning uncertainty and supports more evidence-based infrastructure decisions.
To reach our goal we used the following tech stack:
- Databricks – app serving, data storage and processing platform, jobs orchiestration, geospatial photon functions
- Spark – main data processing tool
- Java – backend development
- Angular – frontend development
- PyTorch – Set Transformer implementation, training and inference
- MLflow – tracking model training and registering model object
Benefits:
Management and decision makers
The solution provided a centralized, reliable source of information on global station performance, traffic distribution, and market position. Decision-makers gained clear visibility into how individual stations and regions operate, enabling more confident, data-driven planning for network expansion and infrastructure investments rather than relying on fragmented analyses or assumptions.
Network planning
By introducing advanced analytics and simulation capabilities, the tool enabled teams to evaluate hypothetical station placements and assess their potential operational and market impacts before any physical deployment. This significantly reduced planning uncertainty and supported long-term network strategy with realistic traffic forecasts and performance scenarios.
Operational and analytical teams
Business and technical users received easy access to integrated, consistently prepared data through an intuitive web application. Automated data processing replaced complex ad hoc analyses, improving collaboration across teams and allowing analysts to focus on insights rather than data preparation, resulting in faster, more reliable daily analytical work.