+48 453 250 842
 office@bitpeak.com

The client
A globally diversified healthcare company with a central purpose to help people live their healthiest possible lives. The organisation offers a broad portfolio of market-leading products that align with favourable long-term healthcare trends in developed and developing markets. With more than 100,000+ employees and 4,000+ FLMS in 160+ countries, discovering new ways to make life better.
The challenge
-
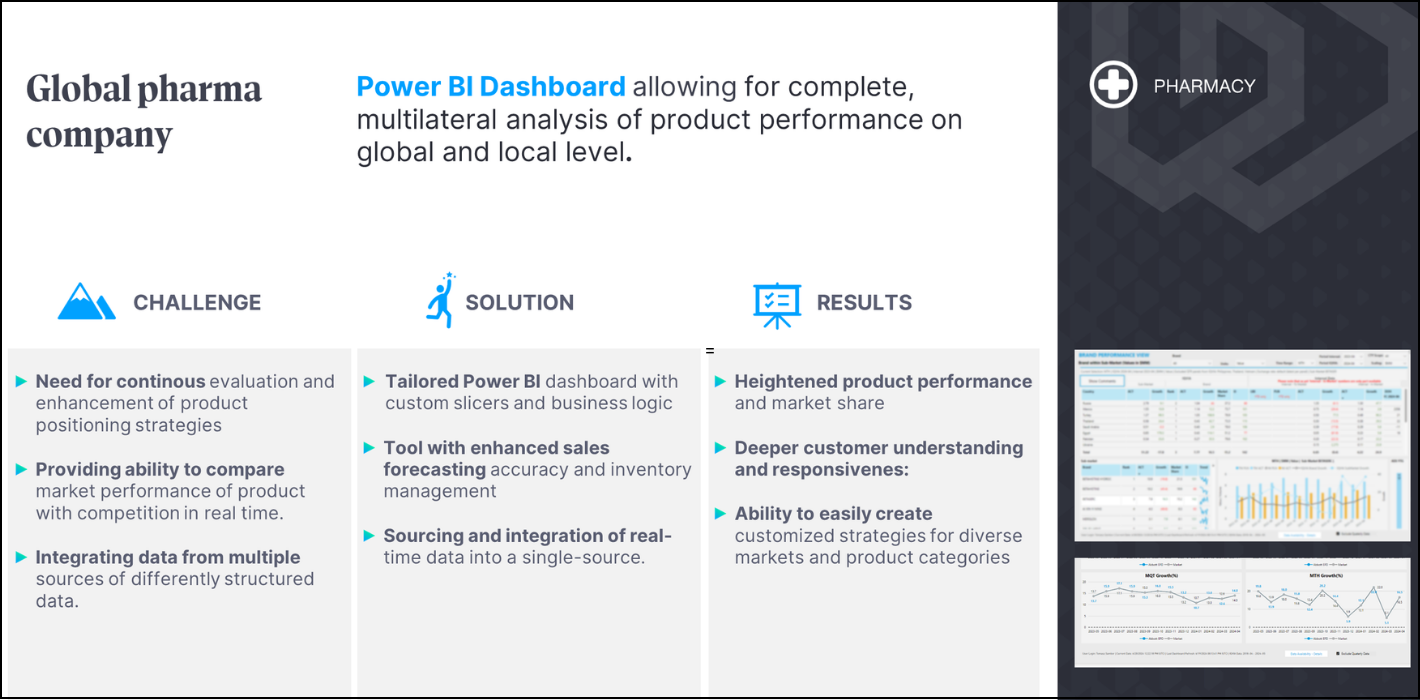
The client struggled to make informed strategic decisions due to a lack of a robust business intelligence solution. They required a system capable of offering a comprehensive overview of product performance and identifying trends relative to competitors.
-
Multidimensional data perspectives, including therapeutic areas, growth drivers, market performance, opportunity mapping, new product launches, pricing, and brand analysis, were needed. The lack of such structured views hindered a full understanding of business dynamics.
-
The client faced difficulties in consistently analysing market performance across different countries and periods. Key indicators like the evolution index and market share comparisons with main competitors were not easily accessible, making it hard to isolate absolute growth drivers.
-
Existing tools failed to encourage widespread data adoption within the organisation due to unreliable datasets and subpar UX, limiting their utility in day-to-day decision-making.
-
The previous solution in place was plagued by long processing times, limited and low-quality data inputs, and lacked critical features—such as the ability to filter sales data by specific time periods—hampering timely and accurate performance analysis.
-
Building a cohesive and accurate market view was challenging because it required integrating disparate, inconsistently formatted data from numerous internal and external sources.
The scope
- Providing a report with multiple advanced analytical functionalities without compromising the solution’s efficiency. Due to complex business logic, BitPeak had to design the ETL processes to minimise the loading times carefully.
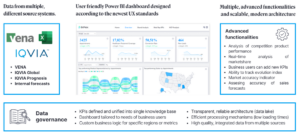
- Due to the scale of the clients’ operations, we had to ensure that we had an easy-to-use interface, a transparent data structure, and insights tailored to business users’ needs on both global and local levels.
- Lastly, we needed to provide a high level of data quality and integrity to ensure reliability of the solution while integrating data from multiple different sources, such as IQVIA, VENA, and Internal databases.
The solution
A dashboard integrated with internal and external databases for clients actively developing in emerging markets enables precise tracking and optimisation of client and competition’s product sales.
Thanks to the complex business logic we designed, we were able to provide the analytical and strategic departments with high-value information about changes in market share, product evolution index, product performance, and more.
We started by establishing unified KPI dictionaries and listing business user needs such as:
- Market forecast accuracy indicator measuring the difference between market growth from real back data and the forecasted scenarios based only on the historic forecast period
- Evolution index against brand market in various contexts (product, country, time ranges)
- Trend of the evolution index
- Brand growth in different time ranges
- Total of given measures according to selection and for all brand markets
Then we delivered a modern, tailored Power BI dashboard with all the functionalities requested by business users, such as:
- The ability to display a selected number of top products by performance
- A chart showing the evolution index trend by country
- Ability to share insights and comments about trends with other users through SharePoint
- Ability to choose a range of data depending on the type of product for the relevant metric calculations
- Incorporated NPI definitions consistent with the internal finance definition
- Ability to freely choose the geographical area from which the data was showcased
To reach our goal, we used the following tech stack:
- Power BI – data visualisation
- SQL – data processing (ETL)
- AWS – data storage
- IQVIA Global – main data source
- Internal forecasts – dupporting data source
- VENA – dupporting data source
- IQVIA prognosis – auxiliary data source
- Excel – masterdata and KPI mapping
Benefits:
Strategy
Our solution allowed for quick, easy access to a high-quality, comprehensive overview of local and global markets for specific products. This allowed for quicker and more accurate decisions about product development and promotion.
Sales
The solution significantly increased the precision and reliability of sales predictions, minimizing instances of stockouts and overstock situations. Thanks to better allocation of resources, we increased the performance of top-tier products, resulting in expanded market share.
Customer
The dashboard allowed our client to gain deeper insights into customer opinions and preferences through analysis of product performance, leading to higher customer satisfaction and loyalty. Real-time data analysis enabled marketing teams to make quick, data-driven decisions and allocate resources more efficiently, leading to higher campaign effectiveness.