+48 453 250 842
 office@bitpeak.com
 Opatowska 2, Warsaw




Language models and agents increasingly reach for company data. Such an agent does not know the specifics of the data or its meaning. It will not ask an analyst what a given column means. If a metric’s definition is not written down, the agent will guess it – sometimes right, sometimes wrong.
That is why the meaning of data should be stored together with the data, in a layer that every tool and every agent uses. Databricks calls this layer semantics and provides concrete mechanisms for it. Below is a description of what it consists of and how it works.
What context consists of
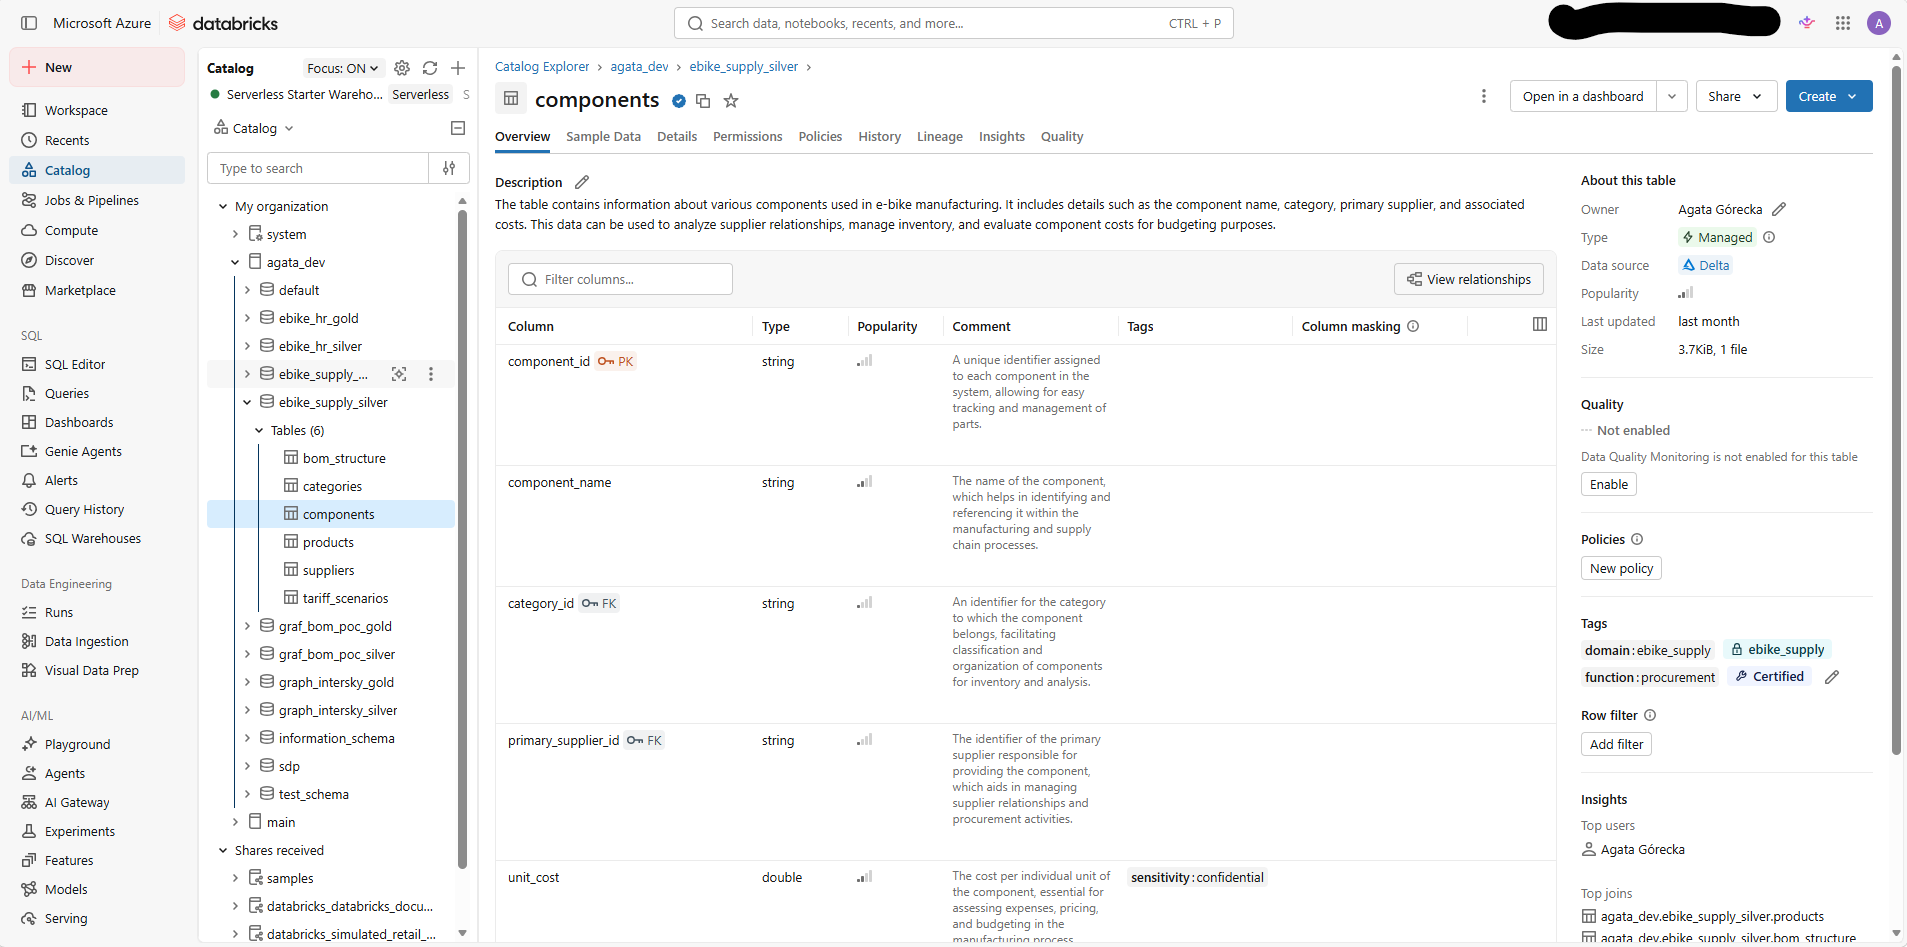
Every table should have a description, and every column a comment. This is the basic context: what the column represents, in what unit, with what constraint. Databricks can suggest descriptions automatically, which speeds up adding them considerably. A person can approve, edit, or reject them.
Tags add structural signals: which domain and function a table belongs to, whether it contains sensitive data. Tags can be used for searching and for access policies.
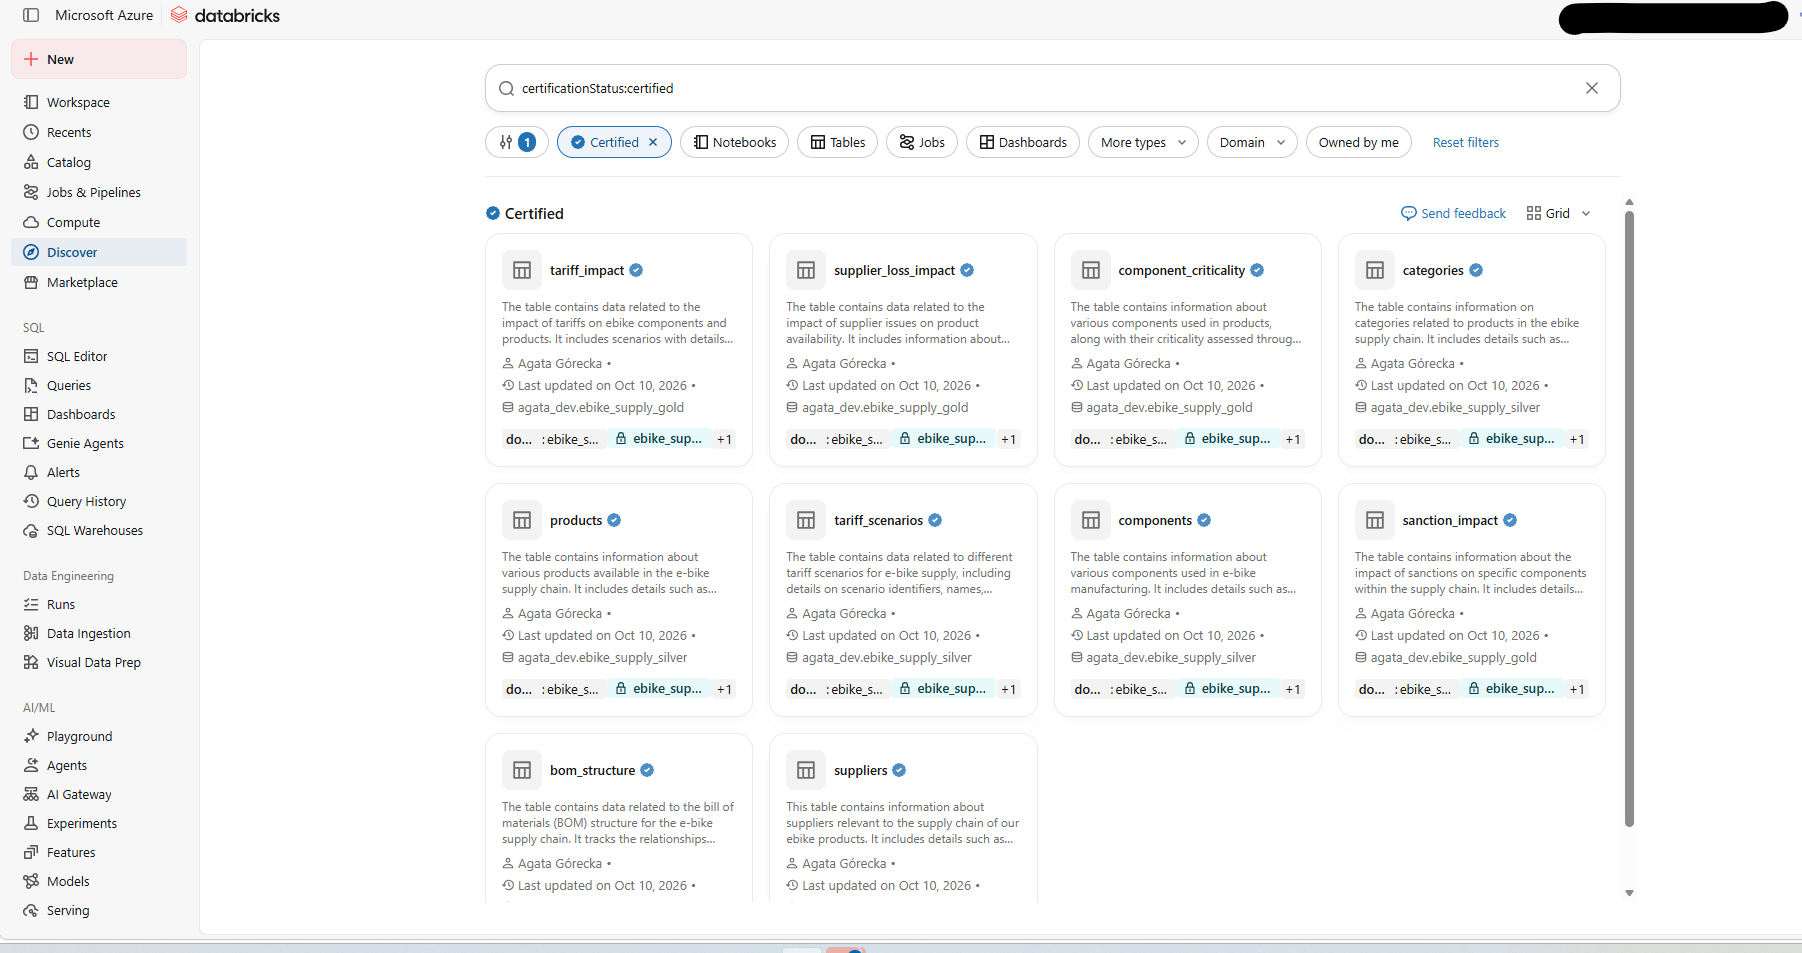
Certification marks an asset as verified and approved. It is a signal of authority, not a judgment of quality – uncertified data is not wrong, it simply has no one formally vouching for it. When several sources exist for one concept, certification shows which one is correct.
Metric Views
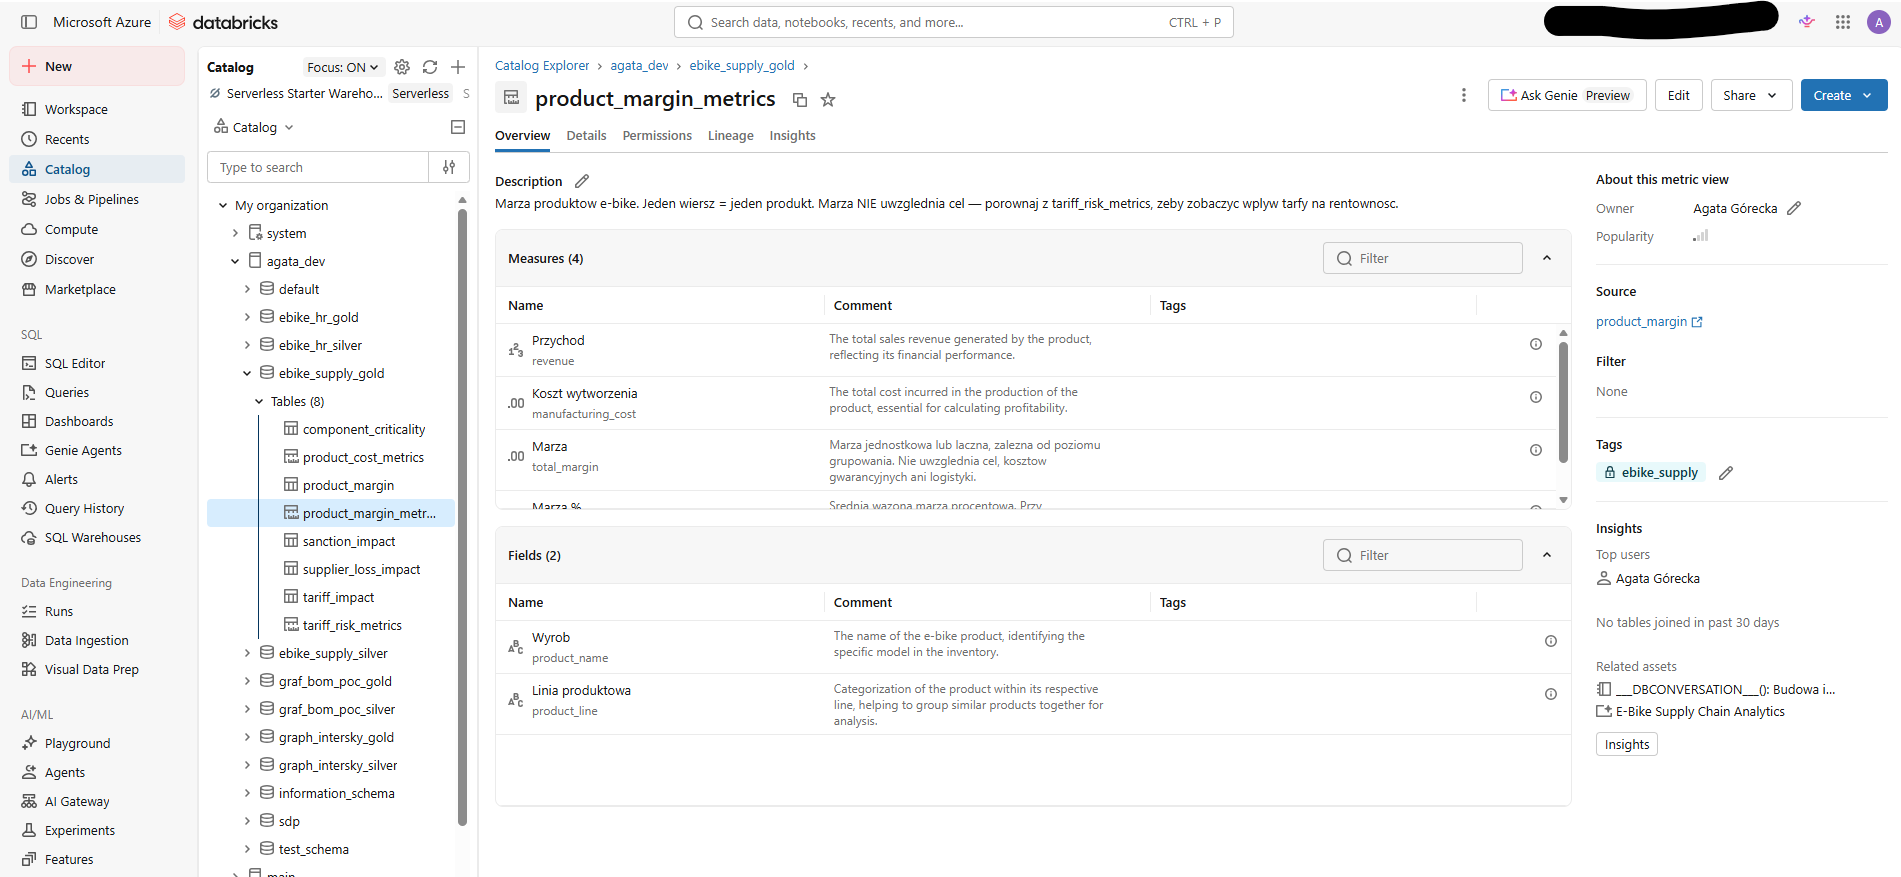
A metric is rarely a single column. Margin, cost, or profitability is the result of a rule computed from many columns.
In many companies a given metric exists in several versions, giving a different result depending on who answers the question. In Databricks we write it once, as code, in a Metric View. The definition contains measures, dimensions, and synonyms. Both BI and the agent use it. As a result, everyone who asks gets a result based on the same definition
Pages
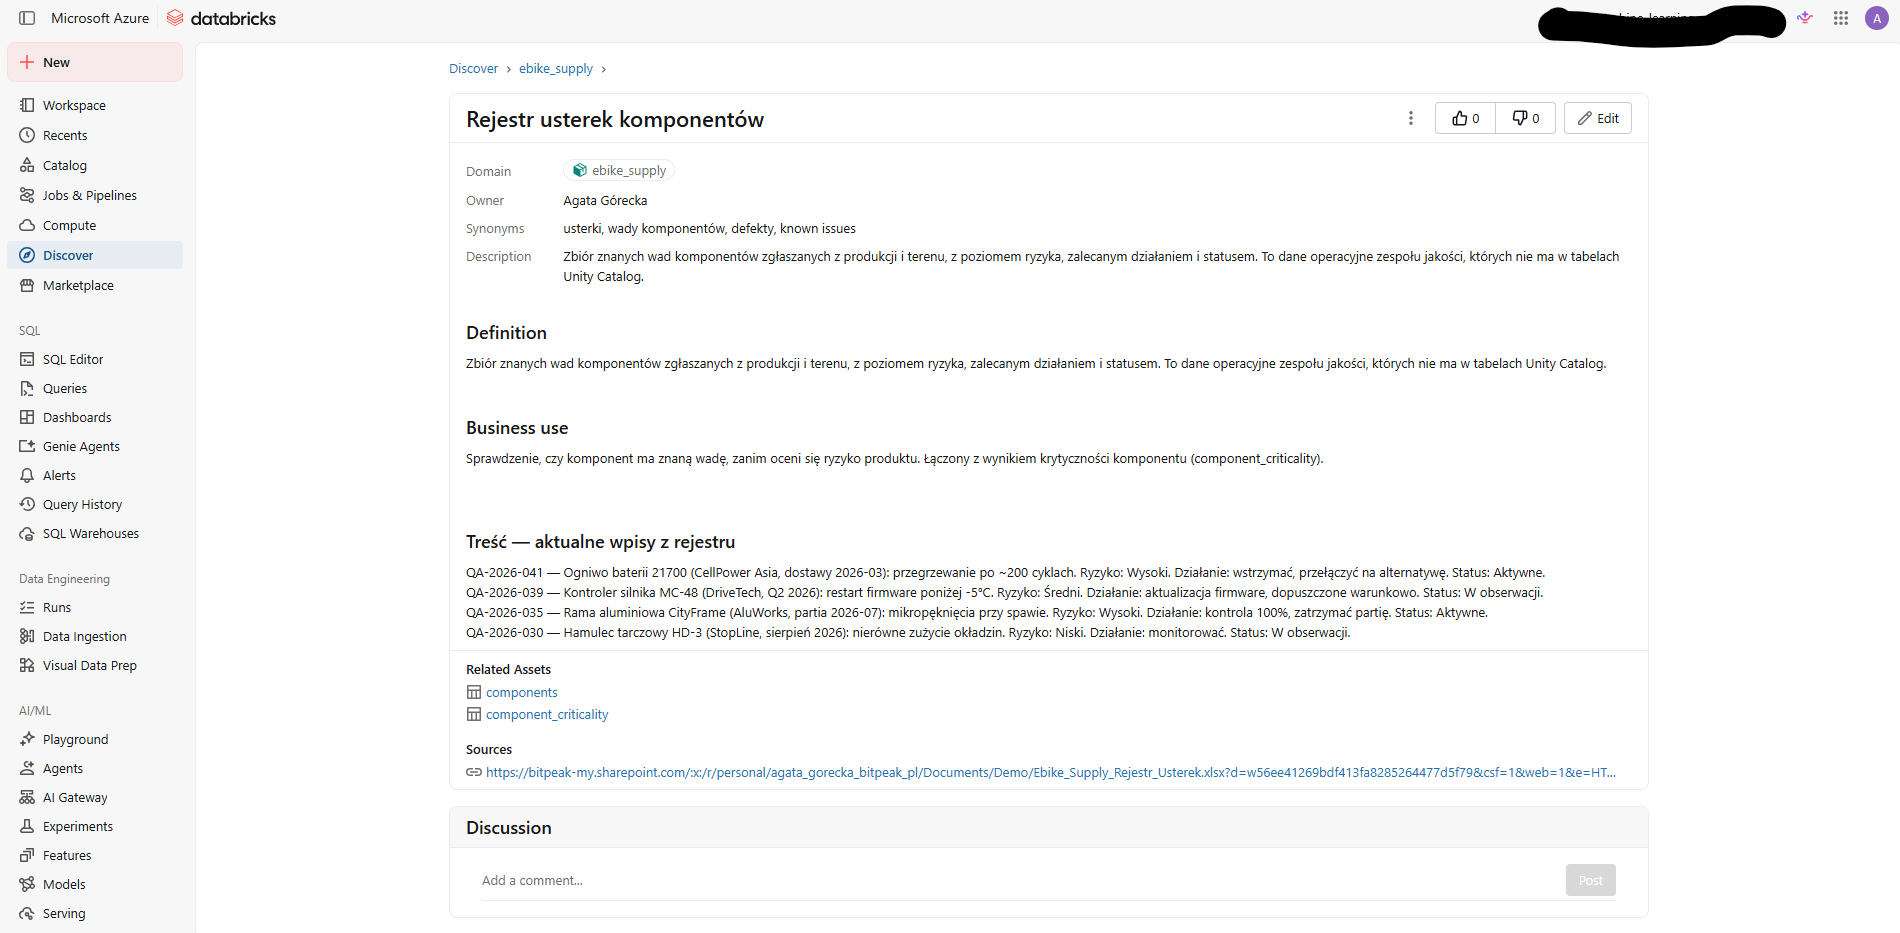
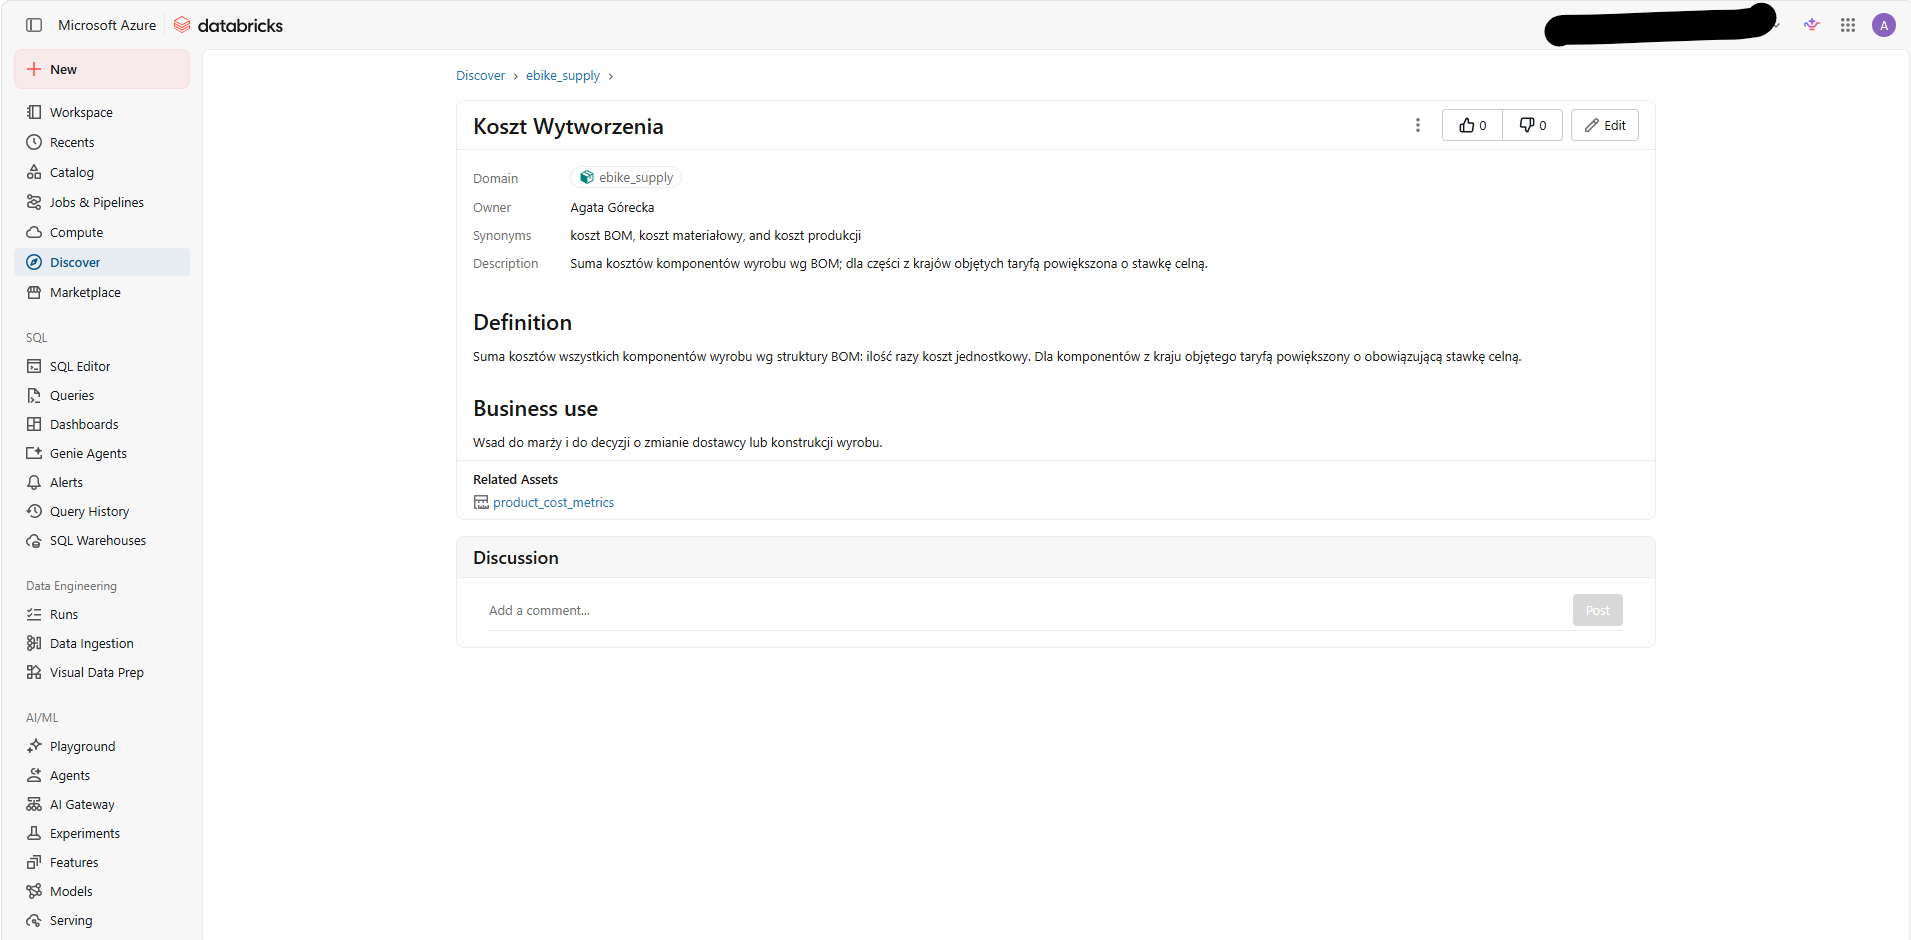
Some business rules do not fit in the data. For example: whether margin includes customs duty. Whether cost includes warranty. Such decisions usually live in documents, not in tables.
Pages store definitions of concepts and point to related assets. Thanks to this, when a term appears in a question, the platform knows which tables and metrics to reach for.
Domain
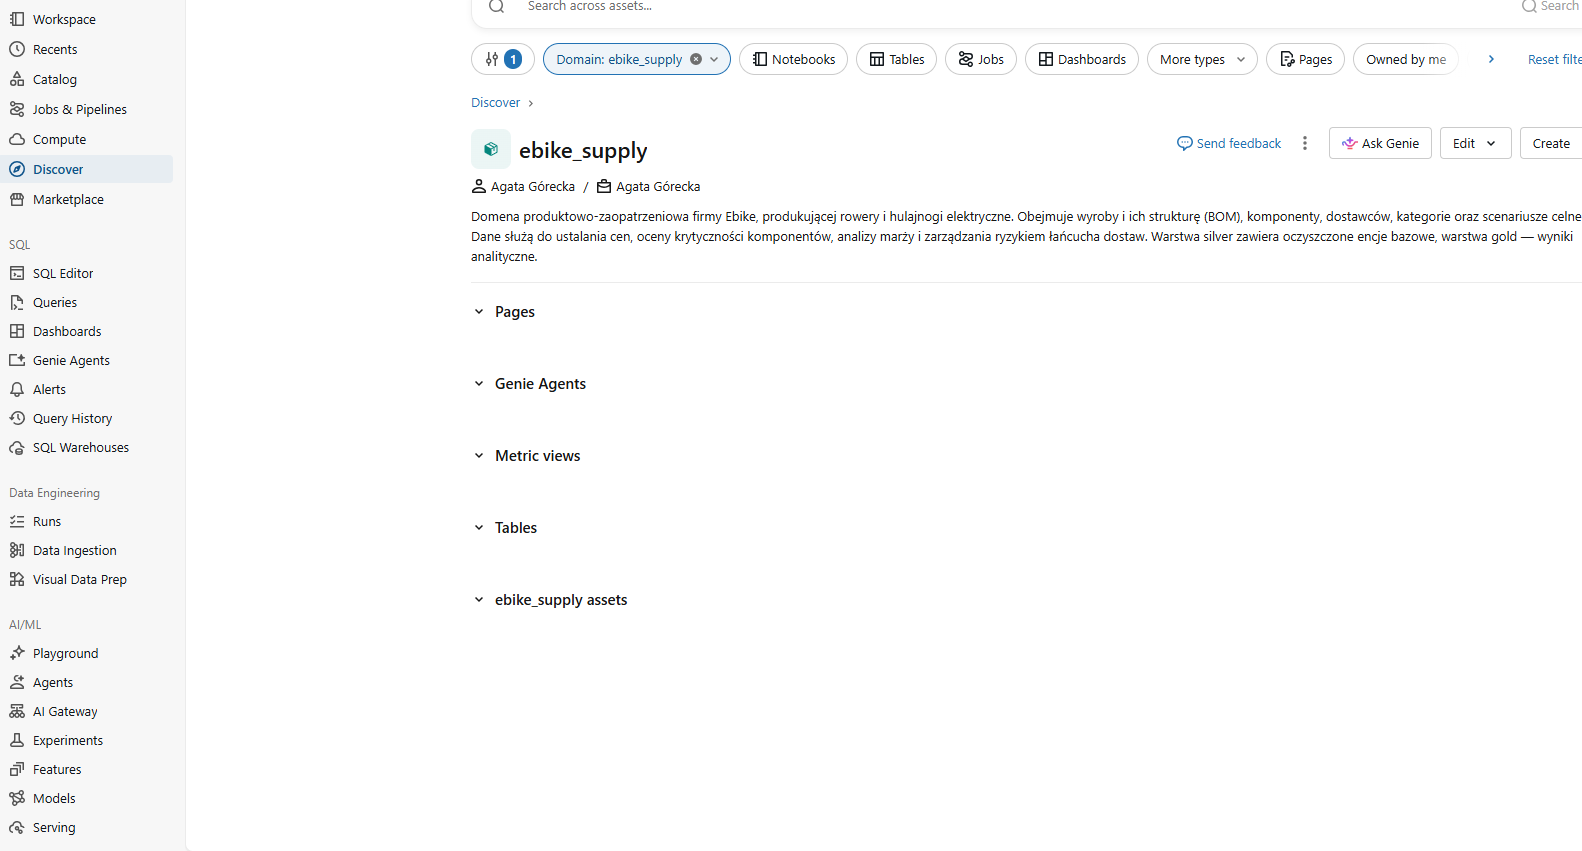
A domain is the highest level at which context is organized in Databricks. It groups assets around a business area, for example sales or the supply chain. It defines what belongs to the area and what does not. A single asset can belong to several domains.
A domain has two jobs. It organizes resources for people, because it is easier to find data by purpose. It also narrows the area for AI: the agent searches within the domain, not the whole catalog. A narrower area means less room for error.
Genie Ontology
Metadata, metrics, domains, and Pages form the modeled context, the one defined manually. Databricks adds inferred context to it: signals the system extracts itself from assets and from usage.
Genie Ontology combines the two. It assigns a relevance score to each piece of context. The score depends on authorship, frequency of use, freshness, and certification, and on this basis the ontology chooses which source to provide for a question. Pieces are filtered by permissions: a consumer sees only what they are entitled to.
The effect of the choice is visible in the answer through source citations. They show which assets fed the answer. The score itself is not published as a separate table. You see its effect, not the number.
Summary
Context in Databricks is not an add-on to data. It is a separate layer that is designed and maintained. Metadata describes elements. Semantics describe concepts. The ontology selects the right source from them. A well-built layer makes the answers, of people and of agents, repeatable and verifiable.
Building it on your own data is project work, not a single configuration. If you are planning this step, we are happy to share what we have learned from implementations.
***
All content in this blog is created exclusively by technical experts specializing in Data Consulting, Data Visualization, Data Engineering, and Data Science. Our aim is purely educational, providing valuable insights without marketing intent.